madrid barajas airport
arch452b- theory of reinforced concrete, spring 2019madrid, es
estudio lamela, rogers stirk harbour + partners
prof. marc sanabra
leila el-erian
winEVA
documentary video
structural data
buidling dimensions: 36m x 72m
tributary area: 9m x 18m
beam length: 36m
beam depth: 1.5m -0.5m
beam spacing: 9m O.C.
composed of a central double s bend and 2 tapered outer sections
four columns;
- 2 central v-shaped and 2 y-shaped
- y-shaped columns support the cantilevered roof
- central columns are tapered

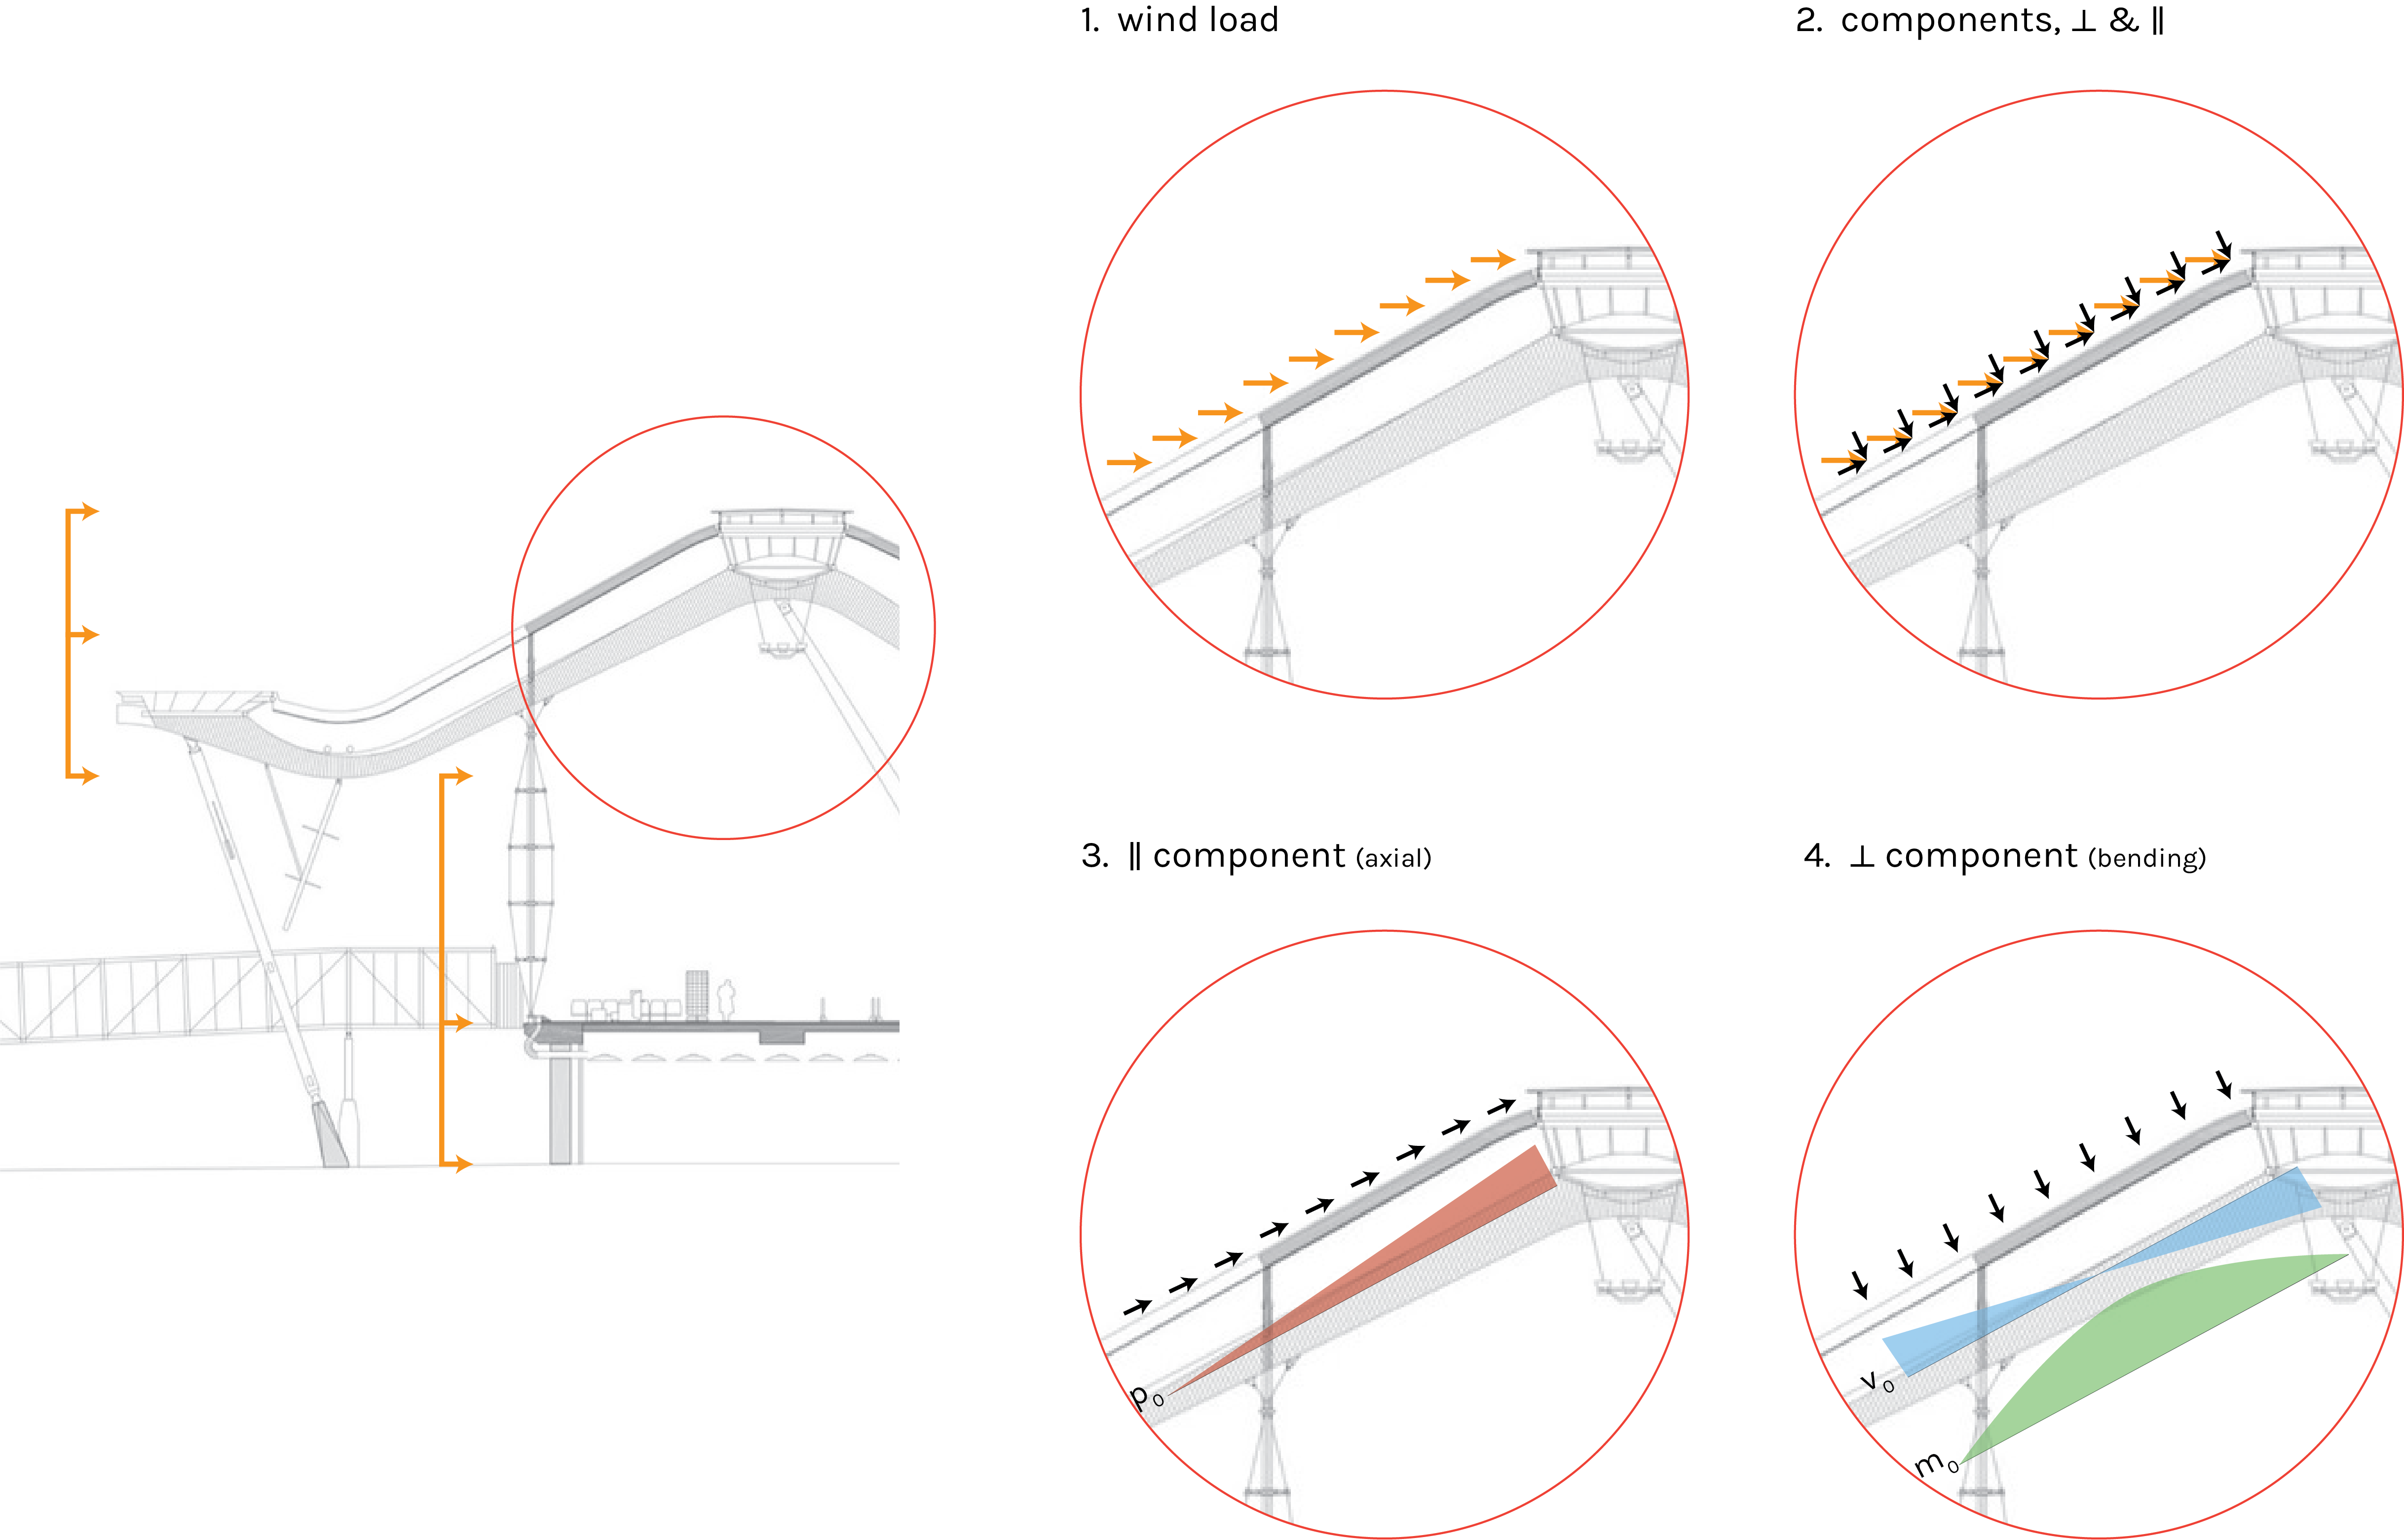
wind loads hit the curved roof and the glass façade. when we focus in on the roof, we can see that there are both axial and bending at work. the roof beam is under compression from the parallel force and under a moment under the perpendicular force.
results
we tested combination 3 and combination 6
combination 3 (gravity loads) = 0.5L + 1.0Lr + 1.2D
combination 6 (wind loads) = 1.0 W + 0.9D
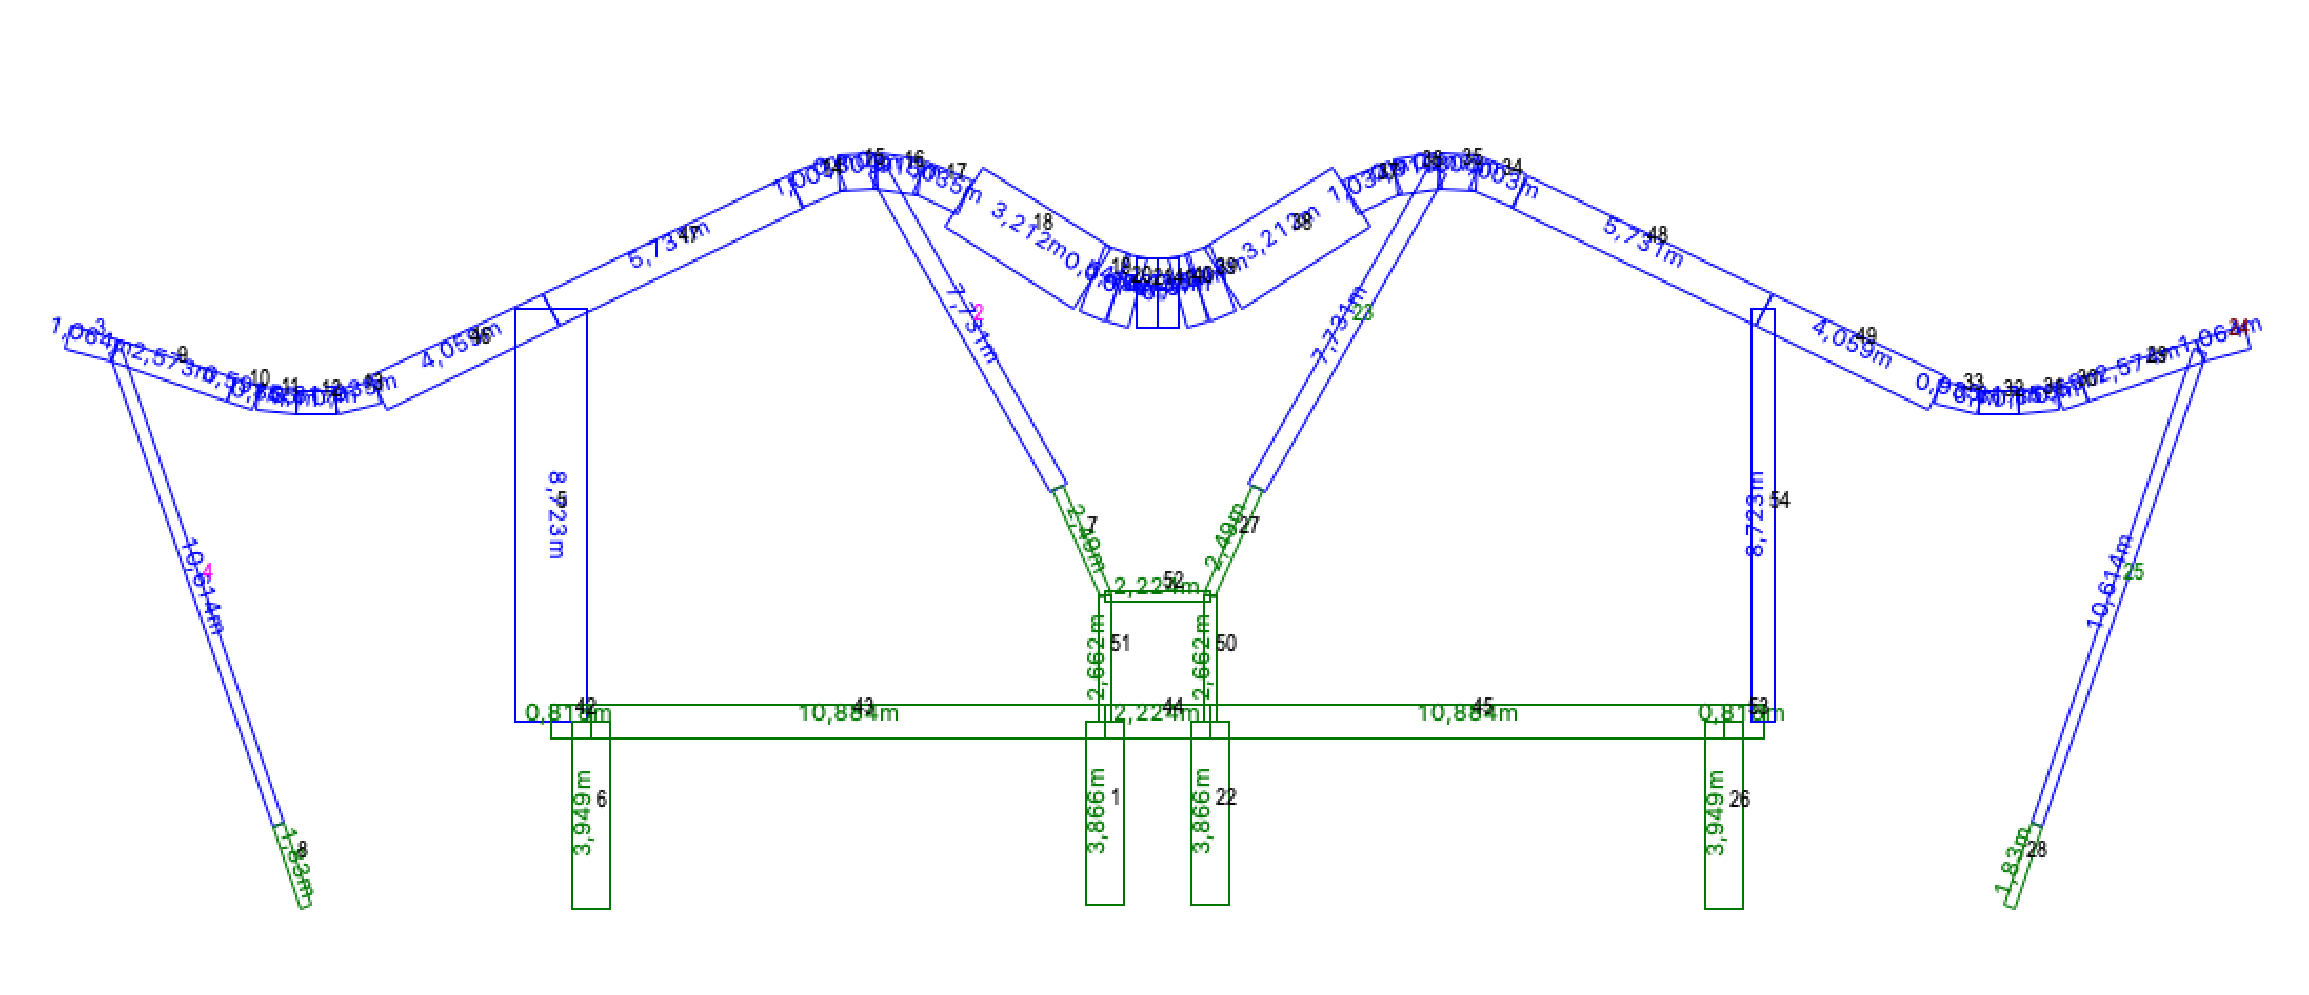
member dimensions
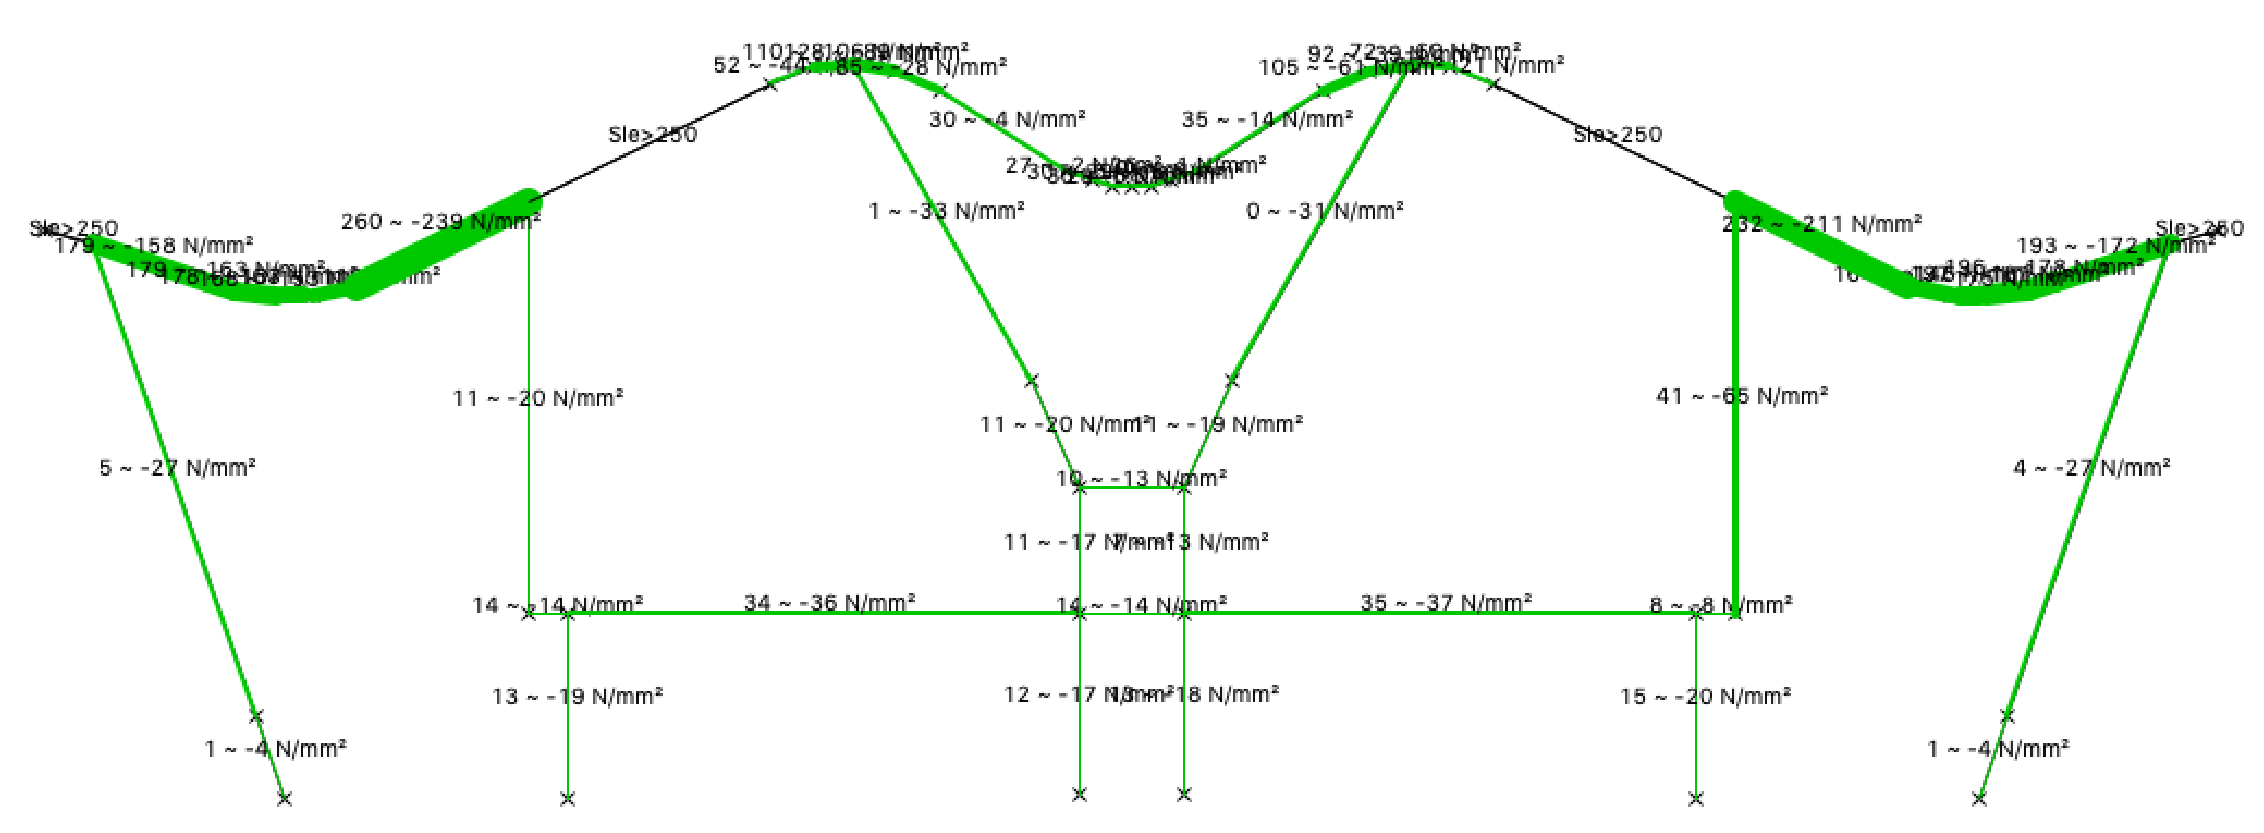
envelope stresses

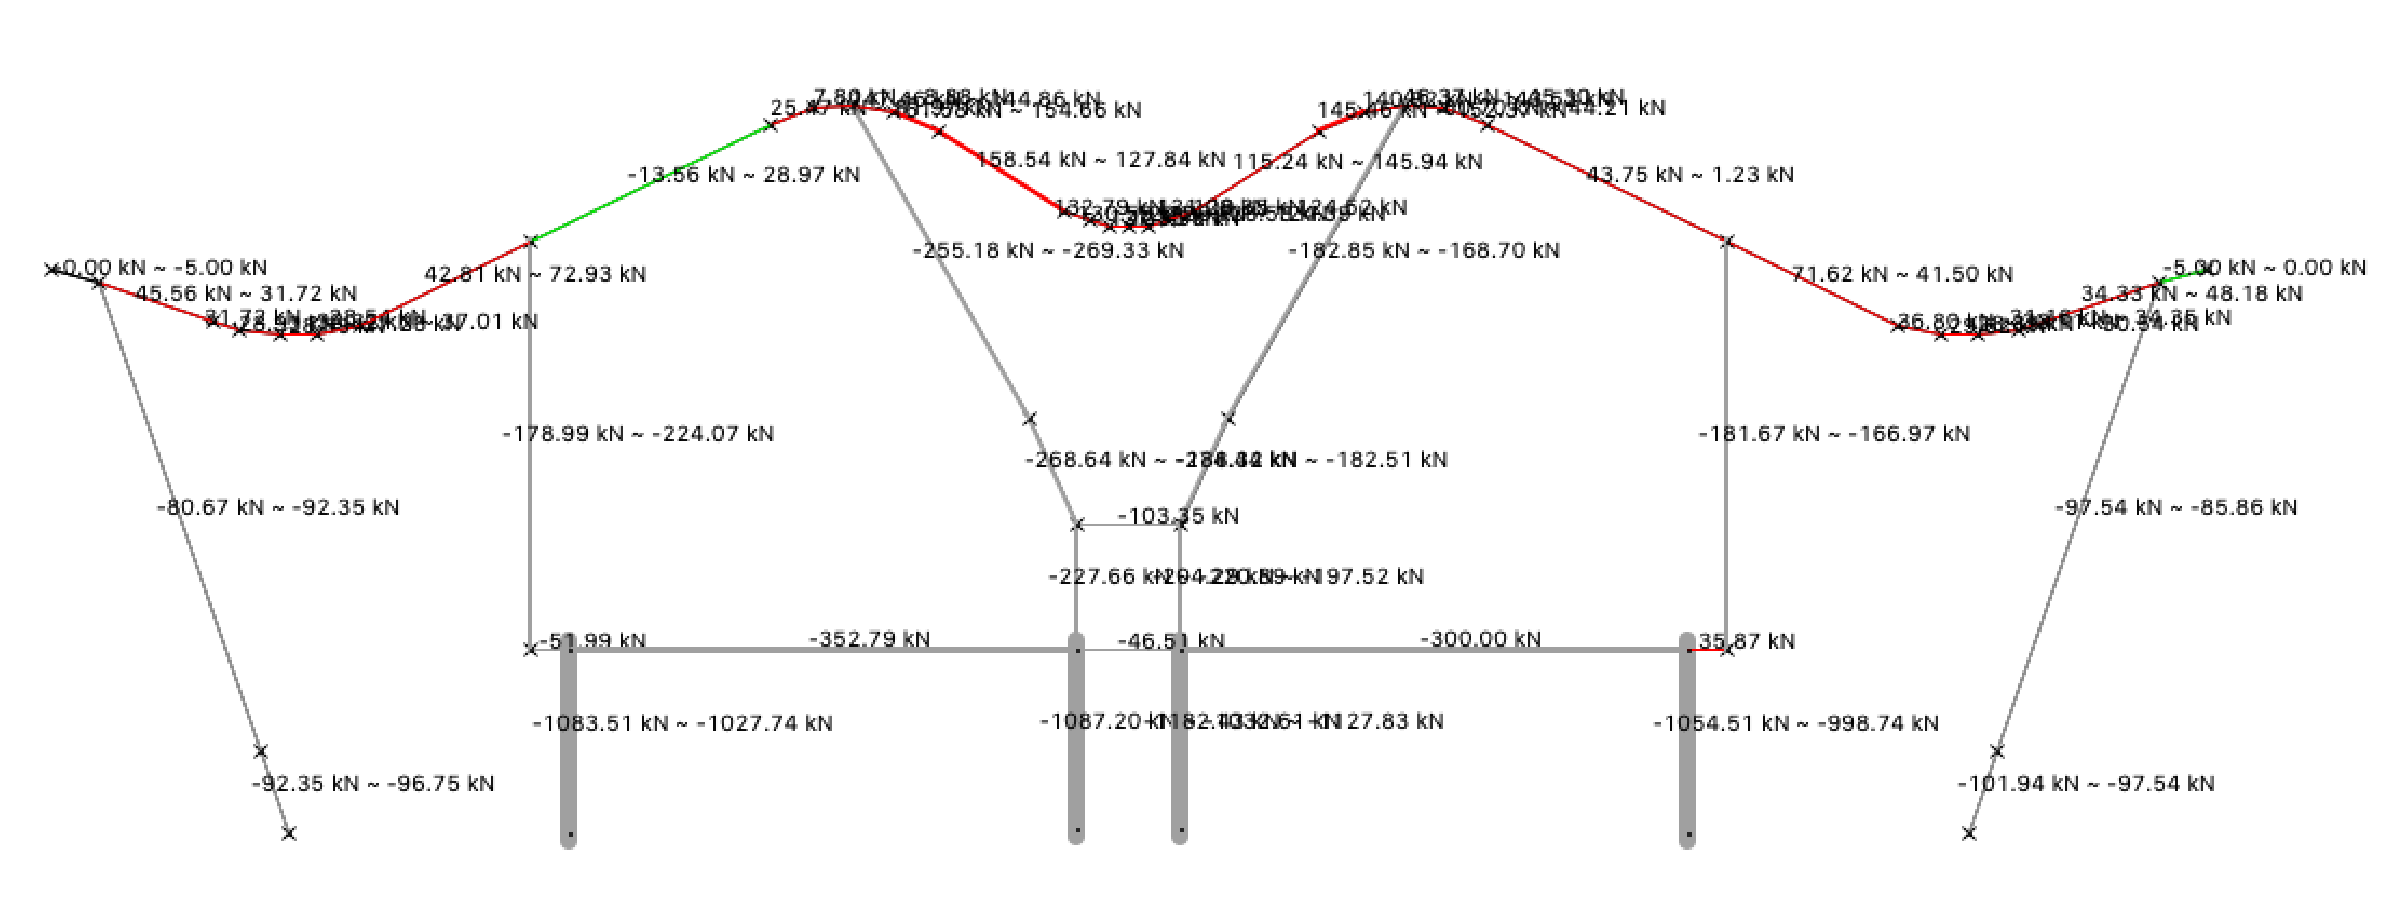
axial forces, gravity loads
axial forces, wind loads
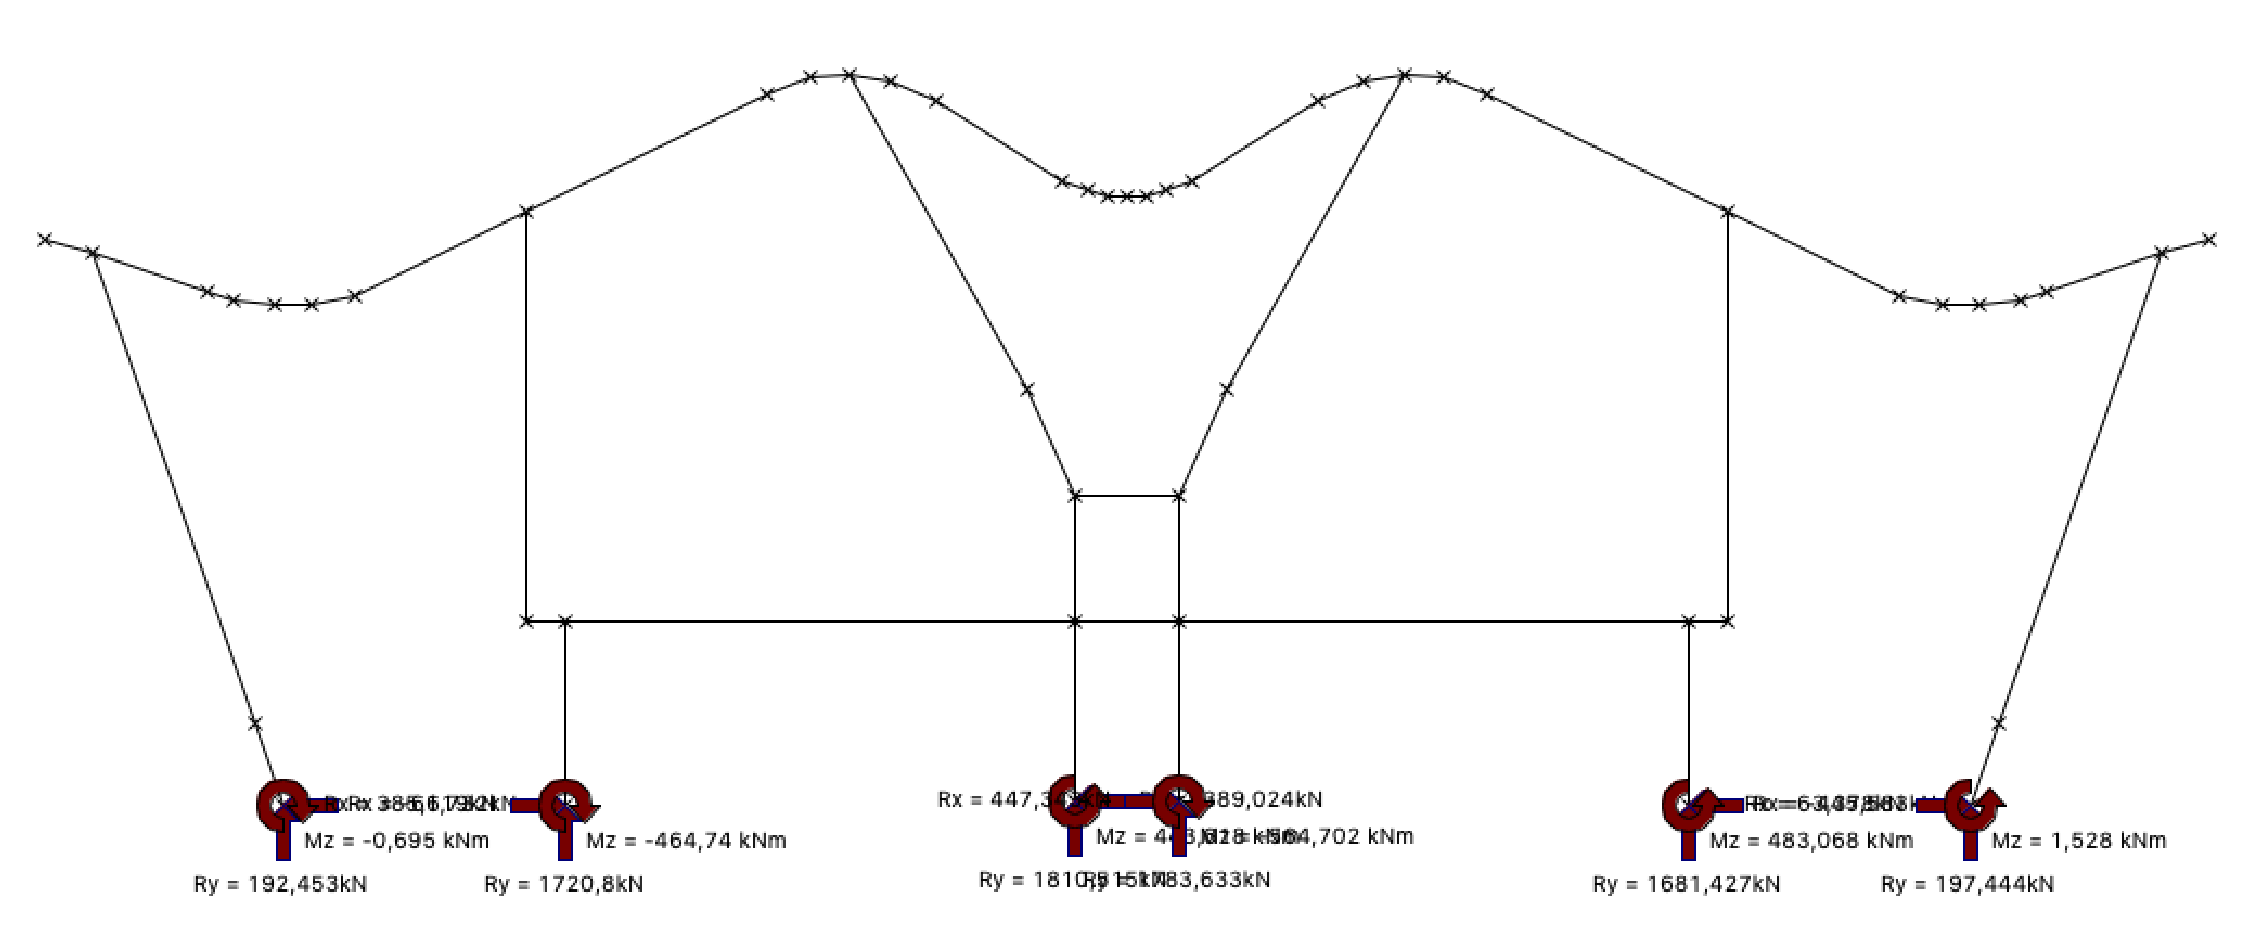

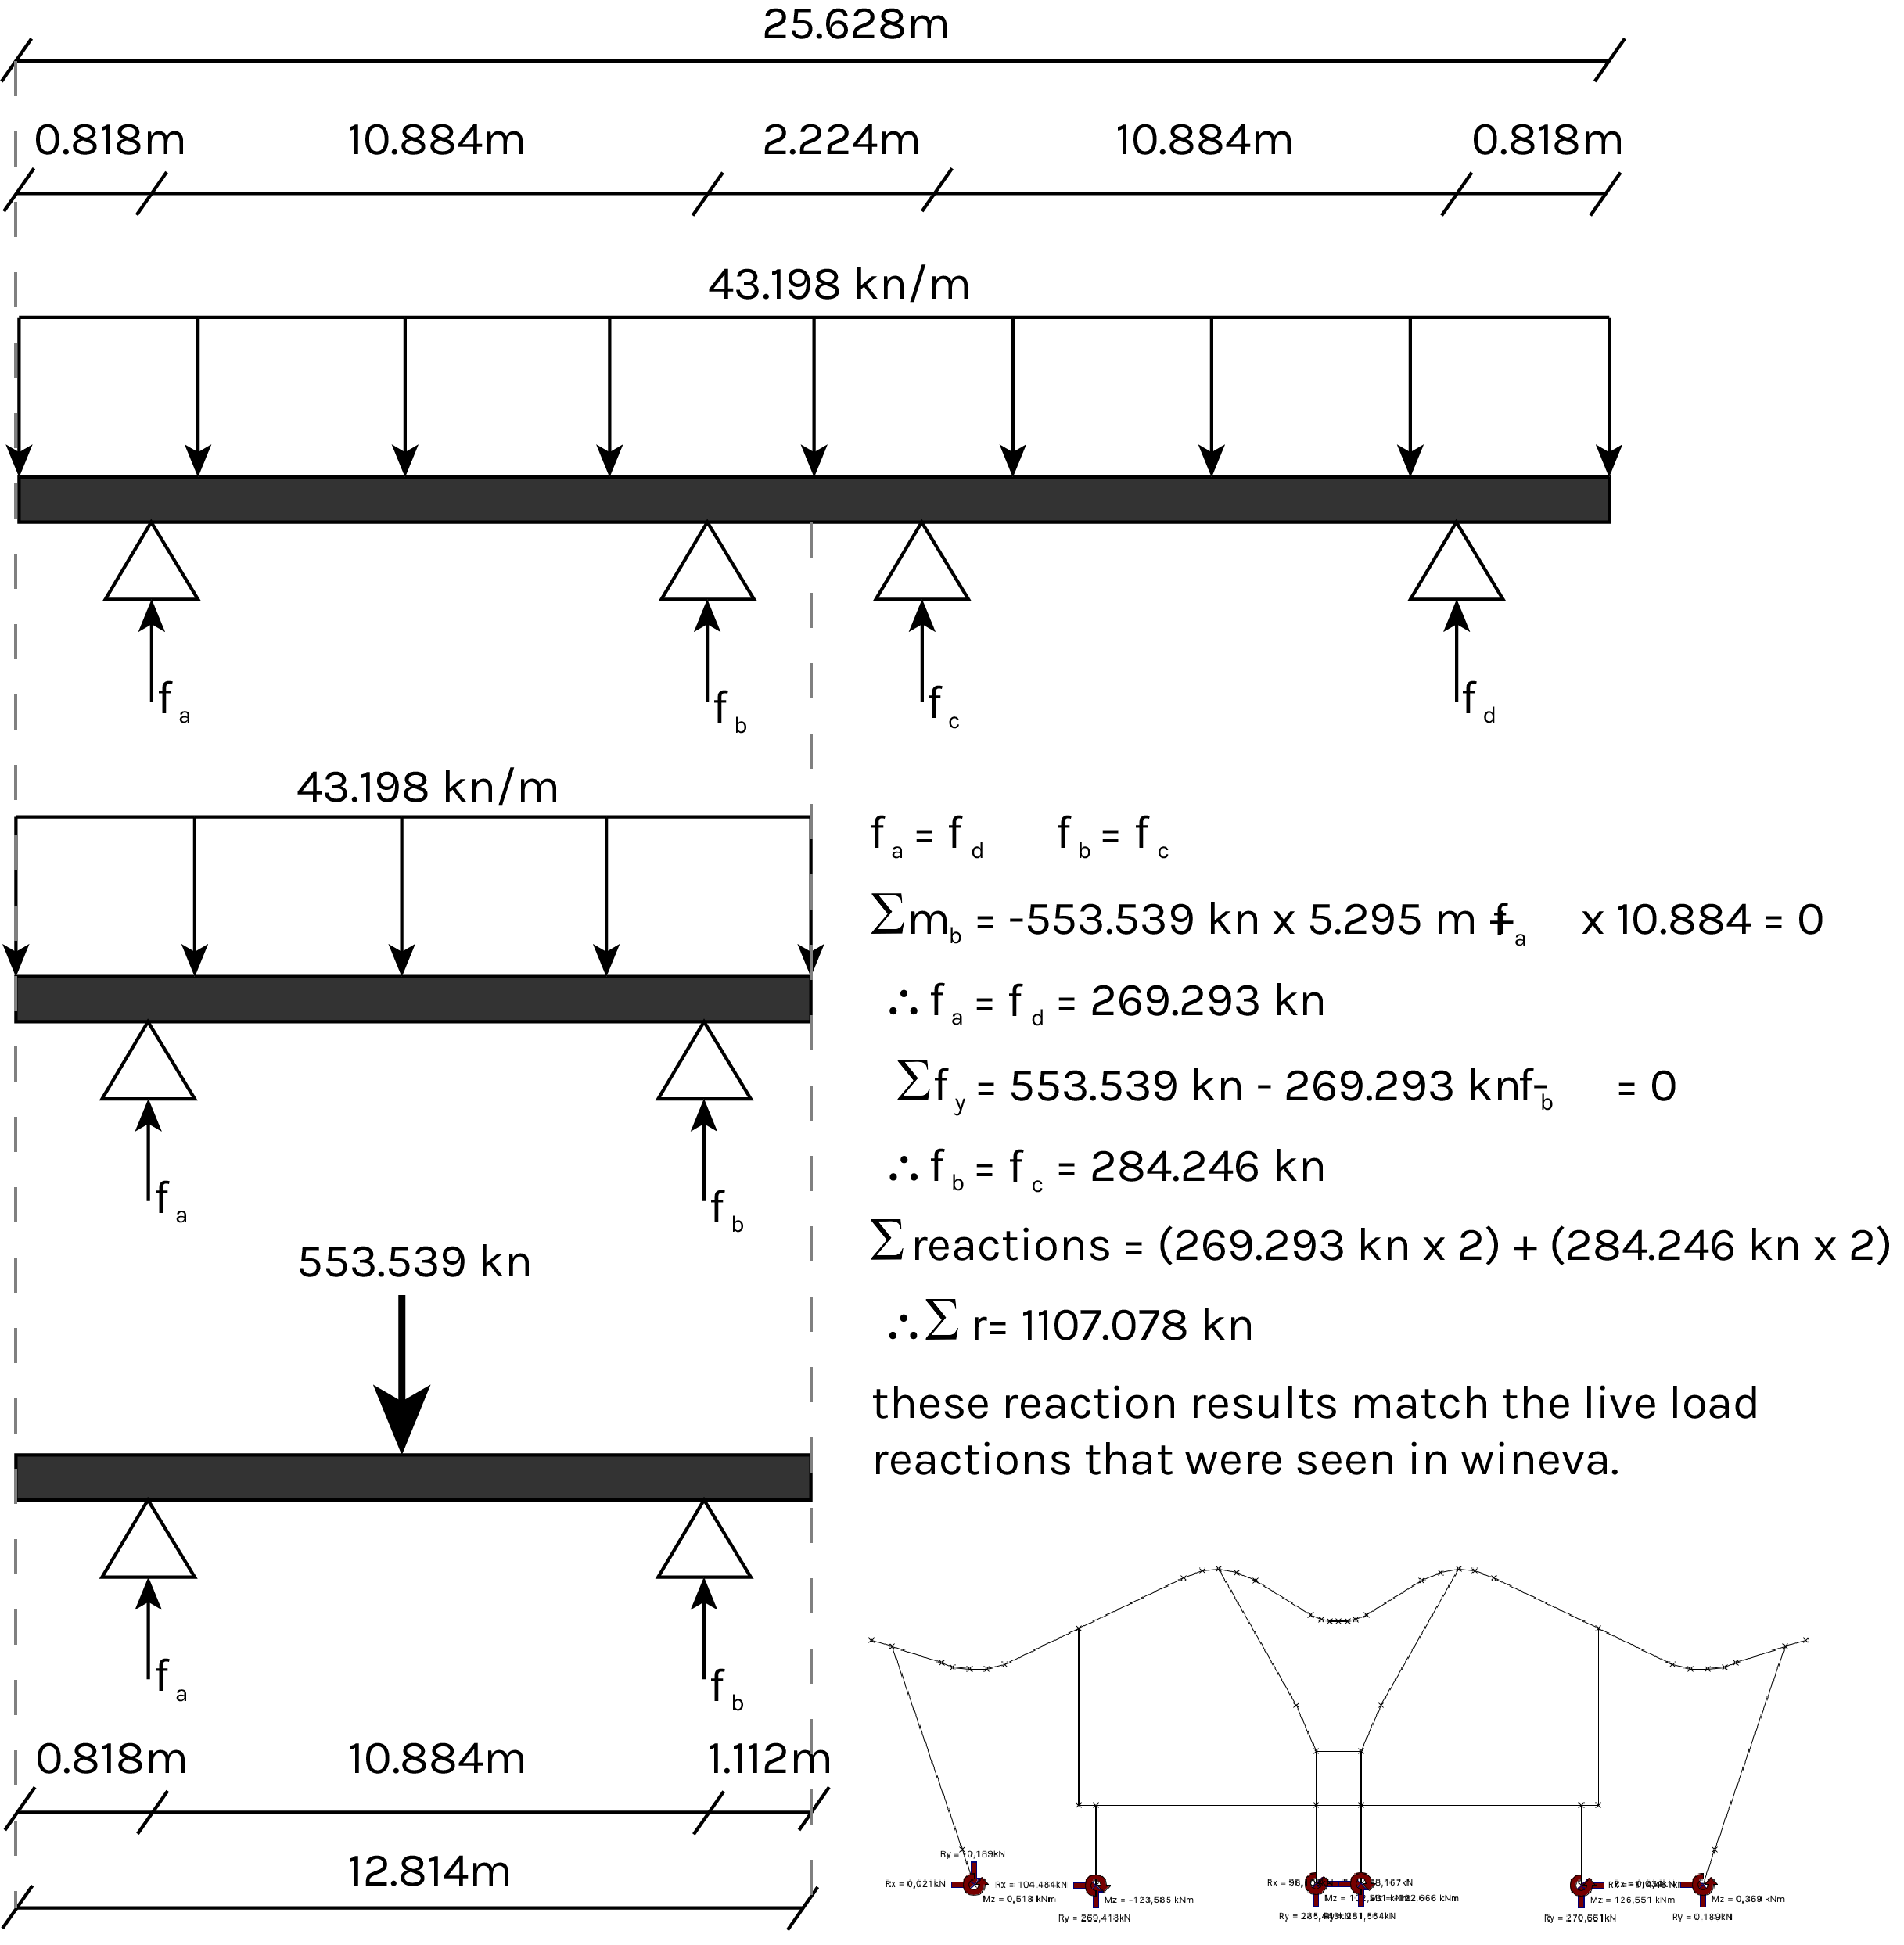
beam reactions, gravity loads
beam reactions, wind loads


shear forces, gravity loads
shear forces, wind loads


flexure moments, gravity loads
flexure moments, wind loads


deflections, gravity loads
deflections, wind loads
hand computations and conclusions
through our analysis of our structure, we found that previous gravity load predictions were inaccurate. the wineva diagrams show shear diagrams that are triangular and vary between positive and negative values, while we had predicted only negative shear forces.
however, the predictions we made for wind loads last semester were fairly accurate. the shear and moment diagrams look identical to those we drew in the last assignment. we suspect that the range written on the axial load diagram is a range for the distributed load, which would correspond to what we had predicted.
we noticed in our analysis that combination 3 (gravity loads), resulted in more critical values in most places, though not everywhere. while the moments on the left-most concrete support are quite low for both combinations, the wind loads are slightly higher; 0.98knm as compared to -0.695knm. what was surprising was the direction of both the moments and the direction of the beam reactions. we were not expecting them to be opposite signs, but given the nature of the lateral loads, this does make sense.
https://faculty.arch.tamu.edu/anichols/courses/applied-architectural-structures/projects-631/Files/madridairport.pdf
https://informesdelaconstruccion.revistas.csic.es/index.php/informesdelaconstruccion/article/view/616/698https://www.rsh-p.com/projects/t4-madrid-barajas-airport/
https://www.archdaily.com/805964/madrid-barajas-airport-terminal-4-estudio-lamela-plus-richard-rogers-partnership